Tracing
Configure, enable, collect, and inspect Phoenix tracing data, including metrics sinks and tracing web app usage.
As of Phoenix 4.1.0, Phoenix supports collecting per-request traces. This allows you to see each important step in a query or insertion, all the way from the client through HBase and back again.
Phoenix leverages Cloudera's HTrace library to integrate with HBase tracing utilities. Trace metrics are then deposited into a Hadoop Metrics2 sink that writes them into a Phoenix table.
Writing traces to a Phoenix table is not supported on Hadoop 1.
Configuration
There are two key configuration files that you will need to update.
hadoop-metrics2-phoenix.propertieshadoop-metrics2-hbase.properties
They contain the properties you need to set on the client and server, respectively, as well as information on how the Metrics2 system uses the configuration files.
Put these files on their respective classpaths and restart the process to pick up the new configurations.
hadoop-metrics2-phoenix.properties
This file will configure the Hadoop Metrics2 system for Phoenix clients.
The default properties you should set are:
# Sample from all the sources every 10 seconds
*.period=10

# Write Traces to Phoenix
##########################
# ensure that we receive traces on the server
phoenix.sink.tracing.class=org.apache.phoenix.trace.PhoenixMetricsSink
# Tell the sink where to write the metrics
phoenix.sink.tracing.writer-class=org.apache.phoenix.trace.PhoenixTableMetricsWriter
# Only handle traces with a context of "tracing"
phoenix.sink.tracing.context=tracing
This enables standard Phoenix metrics sink (which collects the trace information) and writer (writes the traces to the Phoenix SYSTEM.TRACING_STATS table). You can modify this to set your own custom classes as well, if you have them.
See the properties file in the source (phoenix-hadoop2-compat/bin) for more information on setting custom sinks and writers.
hadoop-metrics2-hbase.properties
A default HBase deployment already includes a Metrics2 configuration, so Phoenix Metrics2 config can either replace the existing file (if you do not have custom settings) or be merged into your existing Metrics2 configuration file.
# ensure that we receive traces on the server
hbase.sink.tracing.class=org.apache.phoenix.trace.PhoenixMetricsSink
# Tell the sink where to write the metrics
hbase.sink.tracing.writer-class=org.apache.phoenix.trace.PhoenixTableMetricsWriter
# Only handle traces with a context of "tracing"
hbase.sink.tracing.context=tracing
These are essentially the same properties as in hadoop-metrics2-phoenix.properties, but prefixed with hbase instead of phoenix so they are loaded with the rest of HBase metrics.
Disabling tracing
You can disable tracing for client requests by creating a new connection without the tracing property enabled (see below).
However, on the server side, once the metrics sink is enabled you cannot turn off trace collection and writing unless you remove the Phoenix Metrics2 configuration and restart the region server. This is enforced by the Metrics2 framework, which assumes server metrics should always be collected.
Usage
There are only a couple small things you need to do to enable tracing a given request with Phoenix.
Client Property
The frequency of tracing is determined by the following client-side Phoenix property:
phoenix.trace.frequencyThere are three possible tracing frequencies you can use:
never- This is the default
always- Every request will be traced
probability- Take traces with a probabilistic frequency
- probability threshold is set by
phoenix.trace.probability.thresholdwith a default of 0.05 (5%).
As with other configuration properties, this property may be specified at JDBC connection time as a connection property. Enabling one of these properties only turns on trace collection. Trace data still needs to be deposited somewhere.
Example:
# Enable tracing on every request
Properties props = new Properties();
props.setProperty("phoenix.trace.frequency", "always");
Connection conn = DriverManager.getConnection("jdbc:phoenix:localhost", props);

# Enable tracing on 50% of requests
props.setProperty("phoenix.trace.frequency", "probability");
props.setProperty("phoenix.trace.probability.threshold", "0.5");
Connection conn = DriverManager.getConnection("jdbc:phoenix:localhost", props);
hbase-site.xml
You can also enable tracing via hbase-site.xml. However, only always and never are currently supported.
<configuration>
  <property>
    <name>phoenix.trace.frequency</name>
    <value>always</value>
  </property>
</configuration>
Reading Traces
Once the traces are deposited into the tracing table, by default SYSTEM.TRACING_STATS, but it is configurable in the HBase configuration via:
<property>
  <name>phoenix.trace.statsTableName</name>
  <value>YOUR_CUSTOM_TRACING_TABLE</value>
</property>
The tracing table is initialized via the DDL:
CREATE TABLE SYSTEM.TRACING_STATS (
  trace_id BIGINT NOT NULL,
  parent_id BIGINT NOT NULL,
  span_id BIGINT NOT NULL,
  description VARCHAR,
  start_time BIGINT,
  end_time BIGINT,
  hostname VARCHAR,
  tags.count SMALLINT,
  annotations.count SMALLINT,
  CONSTRAINT pk PRIMARY KEY (trace_id, parent_id, span_id)
)
The tracing table also contains a number of dynamic columns for each trace. A trace is identified by trace ID (request ID), parent ID (parent span ID), and span ID (individual segment ID), and may have multiple tags and annotations. Once you know the number of tags and annotations, you can retrieve them from the table with a query like:
SELECT <columns>
  FROM SYSTEM.TRACING_STATS
  WHERE trace_id = ?
  AND parent_id = ?
  AND span_id = ?
Where columns is either annotations.aX or tags.tX, where X is the index of the dynamic column to look up.
For more usage examples, see TraceReader, which can programmatically read traces from the tracing results table.
Custom annotations can also be passed into Phoenix to be added to traces. Phoenix looks for connection properties whose names start with phoenix.annotation. and adds them as annotations to client-side traces. For example, a connection property phoenix.annotation.myannotation=abc results in an annotation with key myannotation and value abc. Use this to link traces to other request identifiers in your system, such as user or session IDs.
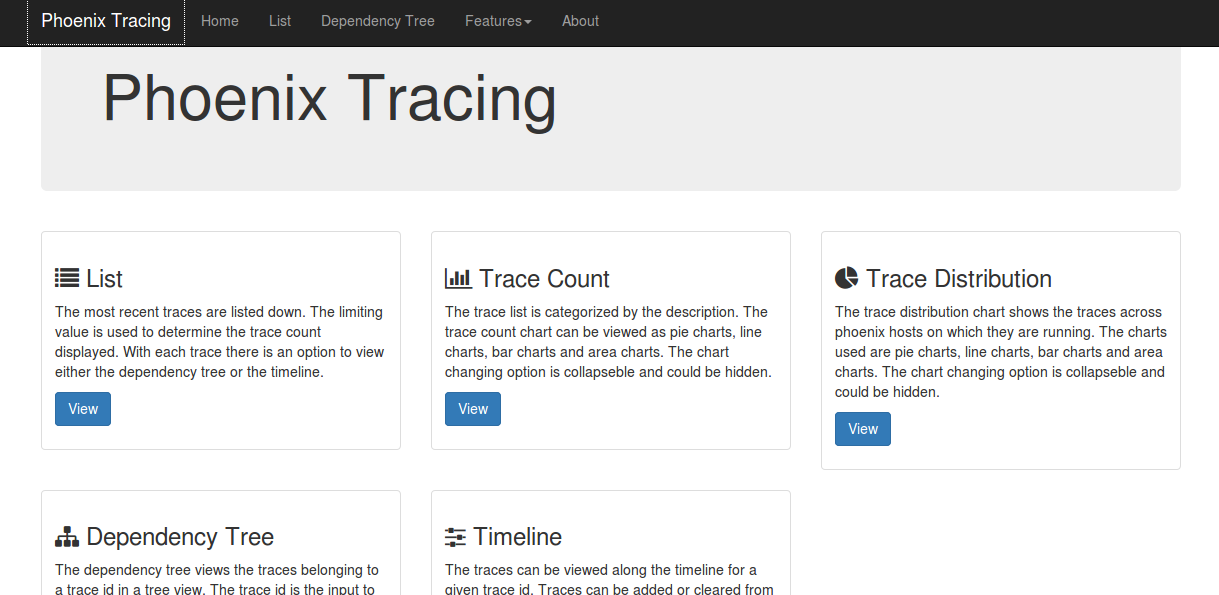
Phoenix Tracing Web Application
How to start the tracing web application
-
Enable tracing for Apache Phoenix as above
-
Start the web app:
./bin/traceserver.py start -
Open this URL in your browser: http://localhost:8864/webapp/
-
Stop the tracing web app:
./bin/traceserver.py stop
Changing the web app port number
Execute the command below:
-Dphoenix.traceserver.http.port=8887Feature list
The tracing web app for Apache Phoenix includes: feature list, dependency tree, trace count, trace distribution, and timeline.
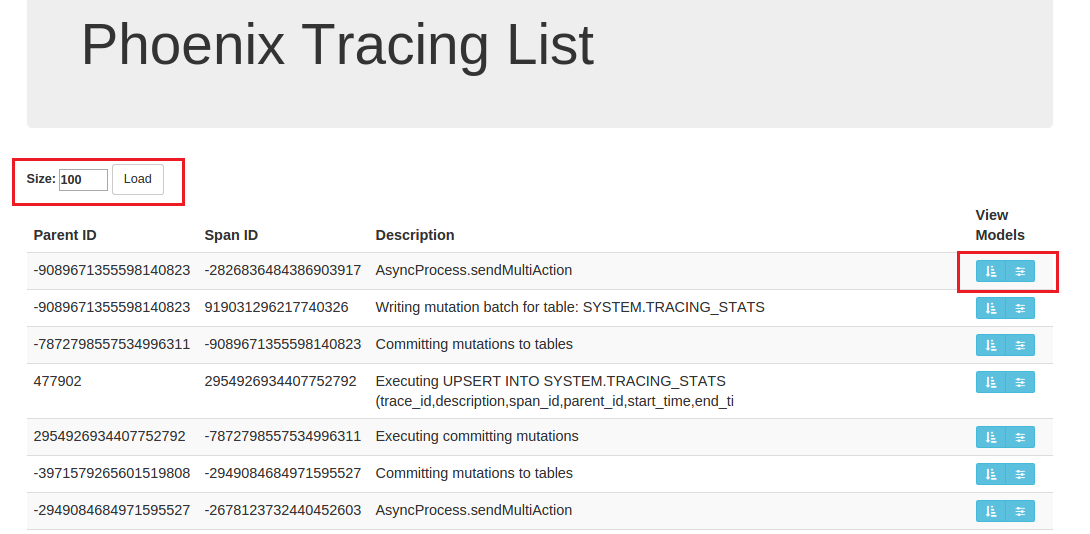
List
The most recent traces are listed down. The limiting value entered on the textbox is used to determine the trace count displayed. With each trace, there is a link to view either the dependency tree or the timeline.
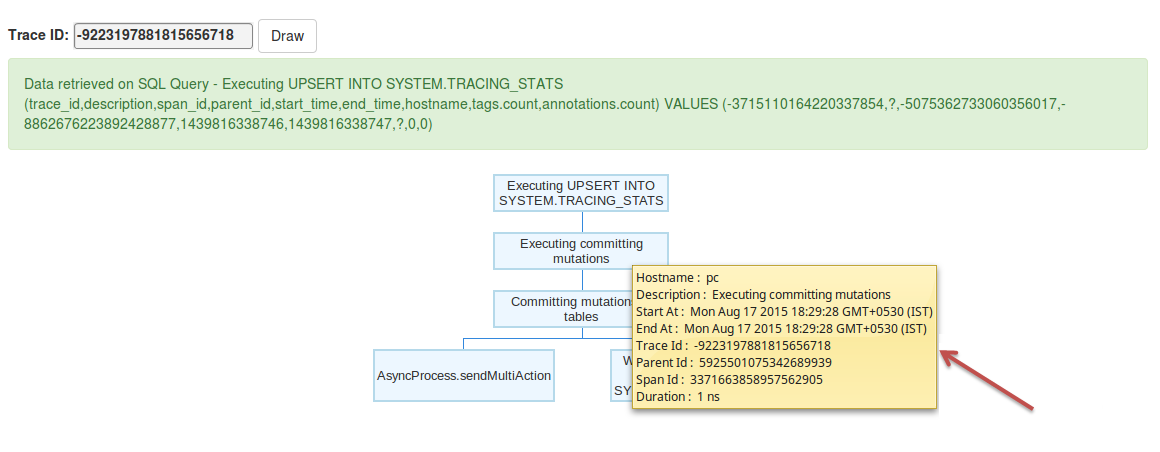
Dependency tree
The dependency tree shows traces for a given trace ID in a tree view. Parent-child relationships are displayed clearly. Tooltip data includes host name, parent ID, span ID, start time, end time, description, and duration. Each node is collapsible and expandable. The SQL query is shown for each tree rendering. Clear is used to remove the tree from view.
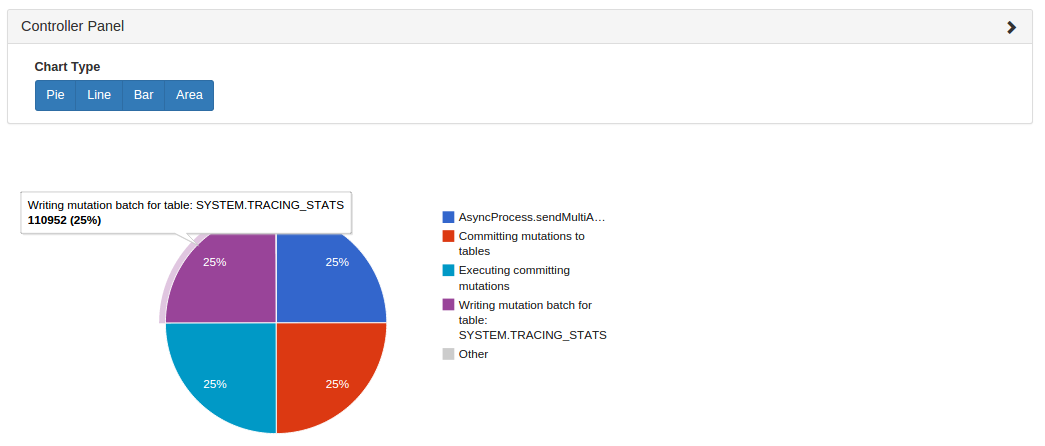
Trace count
The trace list is categorized by description. The trace count chart can be viewed as pie, line, bar, or area chart. The chart selector is collapsible and can be hidden.
Trace distribution
The trace distribution chart shows traces across Phoenix hosts on which they are running. Chart types include pie, line, bar, and area. The chart selector is collapsible and can be hidden.
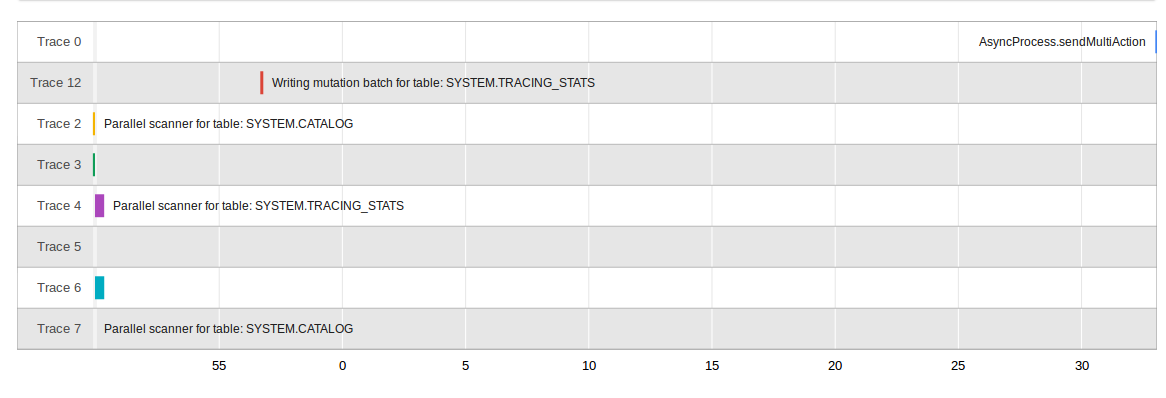
Timeline
The traces can be viewed along the time axis for a given trace id. Traces can be added or cleared from the timeline. There should be a minimum of two traces starting at two different times for the system to draw its timeline. This feature helps the user to easily compare execution times between traces and within the same trace.